
SQL Server Performance Tuning and the OODA Loop

Users are complaining. One of your SQL Servers is not just slow, but slooooooooooooooooowwwwwww. A 6-syllable slow. We’ve all been there. We’ve all had SQL Servers that are underperforming. But where do you start with performance tuning?
Let’s look to a proven approach for decision-making and troubleshooting as our guide – the OODA Loop.
The OODA Loop
U.S. Air Force Colonel John Boyd first developed the OODA Loop technique to aid in combat operations. Since then it’s been applied to wherever a consistent decision-making process is needed. Business, cybersecurity, and even SQL Server performance tuning can benefit for a systematic approach to decision-making.
What is an OODA Loop?
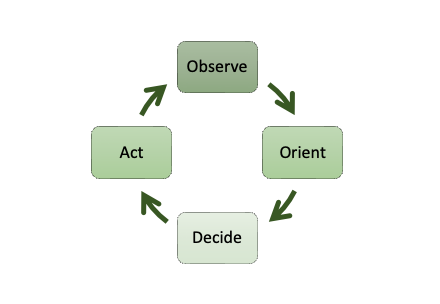
OODA is an acronym for Observe, Orient, Decide, and Act. In it’s original context, each element relates to a combatant in the field.
- Observe. Gain situational awareness of everything that’s happening around you.
- Orient. Put what you’ve just observed into the broader context of what you know.
- Decide. Determine your course of action and what the next step will be.
- Act. Do it. Take the next step.
Then repeat the process.
Applying the OODA loop to SQL Server performance tuning
So, how do we apply the OODA Loop to SQL Server performance tuning?
Observe the SQL Server
You get reports of a SQL Server that’s slow. What does that mean? Are we even sure that SQL Server is the culprit here? Could be. But then again, we don’t know yet. So, let’s check it out.
Pull up your monitoring tool of choice – Solarwinds’ SQLSentry, Redgate’s SQL Monitor, Idera’s SQL Diagnostic Manager, or another tool. If you don’t have a SQL Server specific tool, you can use Extended Events and the Dynamic Management Views to collect information. We typically use our own set of scripts and our SEROShield tools.
There are a lot of metrics you can dive into, but at this point we want to get an overview of the issue. Is there blocking going on? What are the wait stats? Is CPU utilization high? What about Disk I/O performance? What queries are running right now and how long have the been running? Etc.
Orient what you observe with what you know
If SQL Server is indeed running slowly, what else do you know about the system that could be helpful? Some questions to ask.
- Was the system patched recently?
- What changes have been made to the application?
- How do the metrics you’re observing compare to the benchmarks?
- Is this system on the same host as other busy systems? Could this be a noisy neighbor issue?
- Are we in a normally busy period, such as month-end processing or Monday morning log in’s?
- Were there any non-SQL related changes recently such as patches to the operating system?
If this is not a SQL Server that you are familiar with, a SQL Server Health Check may be in order to confirm its configuration. You may find default settings for MaxDOP or Cost Threshold for Parallelism. Or perhaps everything is on the C:\ drive or the Windows Power Plan is set to Balanced. Download our free Common Issues That May Be Putting Your Data at Risk pdf for some of the things we frequently find in our SQL Server Health Checks.
Decide what to do
Now that we have a more complete picture, it’s time to determine the next step in your performance tuning.
Maybe you’ve found that one query in particular was the root cause. It’s consuming way too much CPU and Disk I/O. You could update statistics or create a new index. Or maybe you could review the query plan and rewrite the procedure to remove the ill-performing parts.
Decide what to do.
Act on your decision
Once you’ve identified the next step, it’s time to put your plan into action.
Sometimes the change can be put into production directly. For example, if you found that statistics haven’t been updated since the database was created, you can create and schedule an index and statistics maintenance job to run periodically. We use Ola Hallengren‘s project for this.
Often, however, changes will require testing and verification before they see the light of production.
For example, if you’ve determined that the query needs to be rewritten to remove the nested views (see How do Views Affect SQL Server Performance? for more information) you’ll want to first deploy the changes to a lower level system for testing and validation before updating production.
Don’t neglect change control.
Loop
Don’t forget the last part of the OODA Loop – the loop.
Go back to the first step, Observe, to see how the changes you’ve implemented have affected the performance. If it’s resolved, great. If not, repeat the process.
Need another set of eyes for a problematic SQL Server?
We can help. Schedule a call or send us an email to learn more. It’s easy and there is no obligation.
Recent Comments