
Identifying SQL Server Disk Latency

When SQL Server is not as fast as users think it ought to be, how can you tell where the slowdown is? Where’s the performance bottleneck? Where’s the traffic jam? Is it waiting on CPU? Does it needs memory? What about the disks? Could SQL Server be slow because of disk latency? Could be. But how can we know for sure? Fortunately, we can ask SQL Server what it’s waiting on when it’s waiting for a resource.
There are a couple of easy ways to check for disk latency issues in SQL Server: using the sys.dm_io_virtual_file_stats DMV and using the dbatools.io Test-DbaDiskSpeed command. Let’s look at each.
Check disk latency using DMVs
Way back in SQL Server 2005, Microsoft introduced the sys.dm_io_virtual_file_stats Dynamic Management View (DMV). This DMV reports disk read and write activities for data and log files.
For many years, I’ve used a query based on one from SQLSkills’ Paul Randal. I’ve simply added a column to help quickly categorize/interpret the latency values. This query can be very helpful when troubleshooting what you suspect to be a disk I/O bottleneck.
SELECT
   [ReadLatency] =
        CASE WHEN [num_of_reads] = 0
            THEN 0 ELSE ([io_stall_read_ms] / [num_of_reads]) END,
   [WriteLatency] =
        CASE WHEN [num_of_writes] = 0
            THEN 0 ELSE ([io_stall_write_ms] / [num_of_writes]) END,
   [Latency] =
        CASE WHEN ([num_of_reads] = 0 AND [num_of_writes] = 0)
            THEN 0 ELSE ([io_stall] / ([num_of_reads] + [num_of_writes])) END,
   [Latency Desc] =
         CASE
            WHEN ([num_of_reads] = 0 AND [num_of_writes] = 0) THEN 'N/A'
            ELSE
               CASE WHEN ([io_stall] / ([num_of_reads] + [num_of_writes])) < 2 THEN 'Excellent'
                    WHEN ([io_stall] / ([num_of_reads] + [num_of_writes])) < 6 THEN 'Very good'
                    WHEN ([io_stall] / ([num_of_reads] + [num_of_writes])) < 11 THEN 'Good'
                    WHEN ([io_stall] / ([num_of_reads] + [num_of_writes])) < 21 THEN 'Poor'
                    WHEN ([io_stall] / ([num_of_reads] + [num_of_writes])) < 101 THEN 'Bad'
                    WHEN ([io_stall] / ([num_of_reads] + [num_of_writes])) < 501 THEN 'Yikes!'
               ELSE 'YIKES!!'
               END
         END,
   [AvgBPerRead] =
        CASE WHEN [num_of_reads] = 0
            THEN 0 ELSE ([num_of_bytes_read] / [num_of_reads]) END,
   [AvgBPerWrite] =
        CASE WHEN [num_of_writes] = 0
            THEN 0 ELSE ([num_of_bytes_written] / [num_of_writes]) END,
   [AvgBPerTransfer] =
        CASE WHEN ([num_of_reads] = 0 AND [num_of_writes] = 0)
            THEN 0 ELSE
                (([num_of_bytes_read] + [num_of_bytes_written]) /
                ([num_of_reads] + [num_of_writes])) END,
   LEFT ([mf].[physical_name], 2) AS [Drive],
   DB_NAME ([vfs].[database_id]) AS [DB],
   [mf].[physical_name]
FROM
   sys.dm_io_virtual_file_stats (NULL,NULL) AS [vfs]
   JOIN sys.master_files AS [mf]
   ON [vfs].[database_id] = [mf].[database_id]
      AND [vfs].[file_id] = [mf].[file_id]
-- WHERE [vfs].[file_id] = 2 -- log files
ORDER BY [Latency] DESC
-- ORDER BY [ReadLatency] DESC
-- ORDER BY [WriteLatency] DESC;
GO
When I run this query against a docker-based SQL Server 2017 instance, I receive the following results.
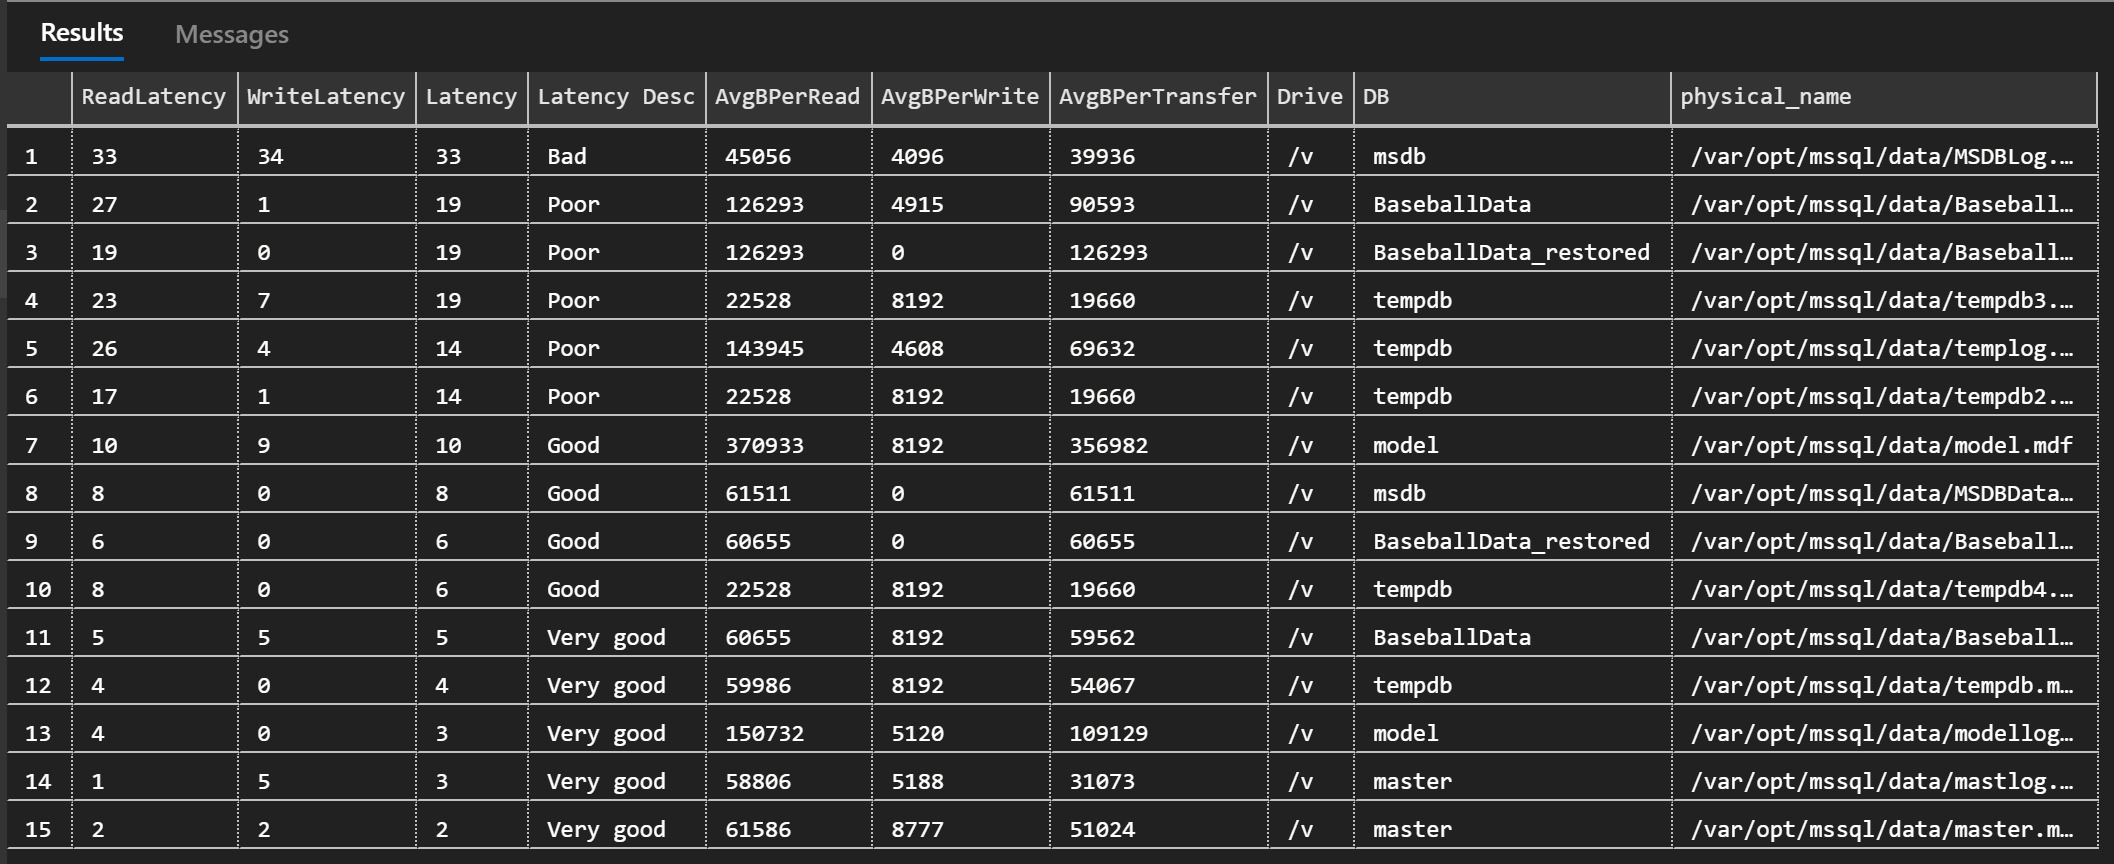
The Latency Desc column helps to interpret the results. Latency can be classified as shown in the following table. Of course, this is a rule of thumb and your needs may vary.
| 0 to 1 ms | Excellent |
| 2 to 5 ms | Very good |
| 6 to 10 ms | Good |
| 11 to 20 ms | Poor |
| 21 to 100 ms | Bad |
| 101 to 500 ms | Yikes! |
| more than 500 ms | YIKES!!! |
Check disk latency using dbatools
Fans of dbatools.io may already know that something similar to the query above is included as part of the Test-DbaDiskSpeed command.
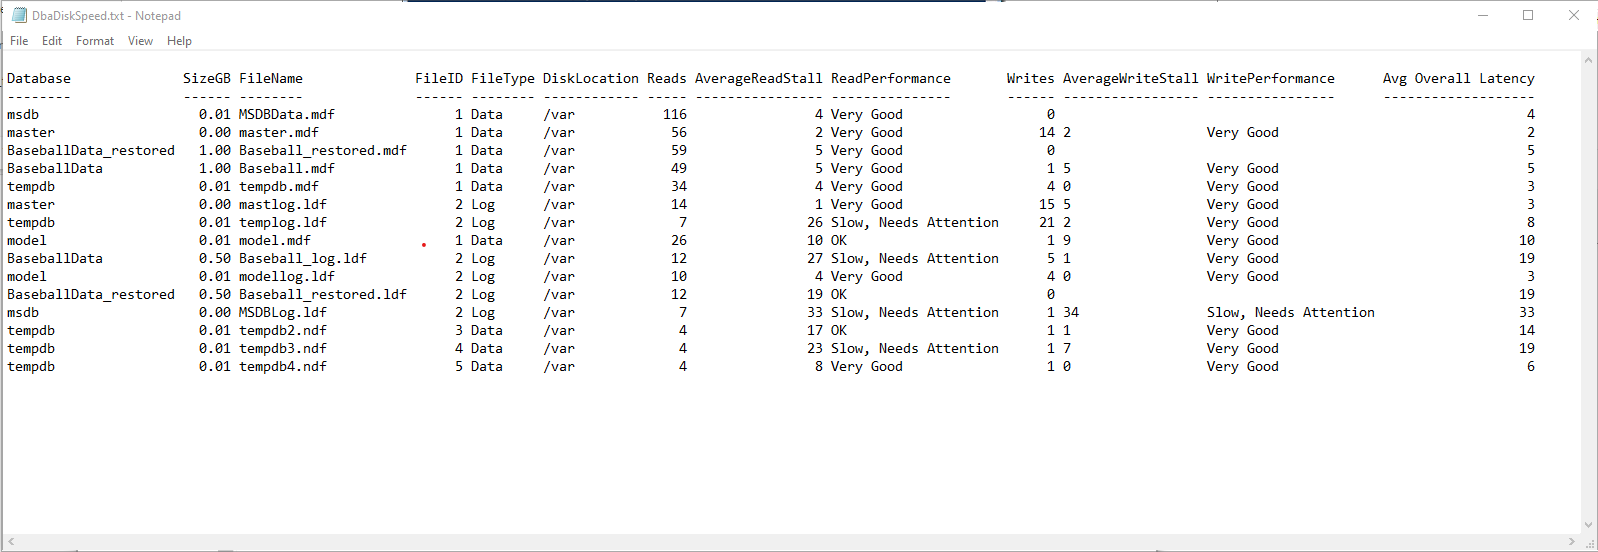
You can run the command as-is, only providing the instance and credentials to use. I typically add a few other options to format the output into a table and send it to a file that I can easily examine.
Test-DbaDiskSpeed -SqlInstance localhost -SqlCredential sa | Format-Table -Property Database, SizeGB, FileName, FileID, FileType, DiskLocation, Reads, AverageReadStall, ReadPerformance, Writes, AverageWriteStall, WritePerformance, 'Avg Overall Latency' | Out-String -Width 4096 |out-file c:\temp\DbaDiskSpeed.txtRunning the PowerShell script on my docker-based SQL Server 2017 instance provides the following output file.
Let’s not ask SQL Server about disk latency
Of course, there will be those who mistrust the results from either of these methods, because, well, of course SQL Server wouldn’t fess up to being the bottleneck. It’s obviously going to point the finger elsewhere.
To address those claims, check out Identify Disk I/O Performance Issues for Your SQL Server Using DiskSpd. That tool completely removes SQL Server from the discussion and objectively tests the disk I/O.
But for a quick sanity check, you can’t beat the sys.dm_io_virtual_file_stats DMV and the Test-DbaDiskSpeed command.
Looking for other ways to diagnose or improve performance? Here are a few other posts that may help.
- Should I Add Hardware Resources to My SQL Server? Do This First.
- SQL Server Performance and Windows Power Plan
- How do Views Affect SQL Server Performance?
- Is My SQL Server Configured Properly?
Want to work with The SERO Group?
Want to learn more about how SERO Group helps organizations take the guesswork out of managing their SQL Servers? It’s easy and there is no obligation.
Schedule a call with us to get started.
One Response
[…] Identifying SQL Server Disk Latency […]
Comments are closed.