
Analyzing Disk Latency in Azure Virtual Machines – Part 2

“I thought the cloud was supposed to be fast. Why are things moving like a sloth?” Have you heard someone complain about the speed of an application after moving it to the Microsoft Azure? Azure is a good environment, but things are not always fast in the cloud. To illustrate, in this post, we’ll review an Azure VM experiencing high disk latency and determine if the bottleneck is due to the VM size or the disk size. This is part 2 of Analyzing Disk Latency in Azure Virtual Machines.
The specs for the VM we’re using are:
- Standard B4ms (4 vcpus, 16 GiB memory) – Supports up to 2880 IOPs or 35 MBps.
- Target disk – Standard SSD E10 – 500 IOPs or 60 MBps. This drive is capable of bursting to 600 IOPs or 150 MBps.
We’ll use Microsoft’s diskspd utility to generate the load using the 8kb block size.
Azure VM Metrics – Reviewing disk-related counters
Using Azure VM Metrics, you can review numerous counters related to the VM and create alerts based on a set threshold. We’re focused on the following counters within the Virtual Machine Host namespace. Three separate charts are used. FYI, filters can be added if you’re only interested in a specific disk. Identify the disk LUN and then add the LUN filter to the chart.
Disk Throughput / Sec – Write and Read
- Data Disk Write Bytes/sec
- Data Disk Read Bytes/sec
Disk Operations / Sec (IOPs) – Write and Read
- Data Disk Write Operations/sec
- Data Disk Read Operations/sec
Disk Latency
- Data Disk Latency (Preview)
The screenshot below shows each one of the counters. The time range has been set to the last 30 minutes, which refreshes every 5 minutes.
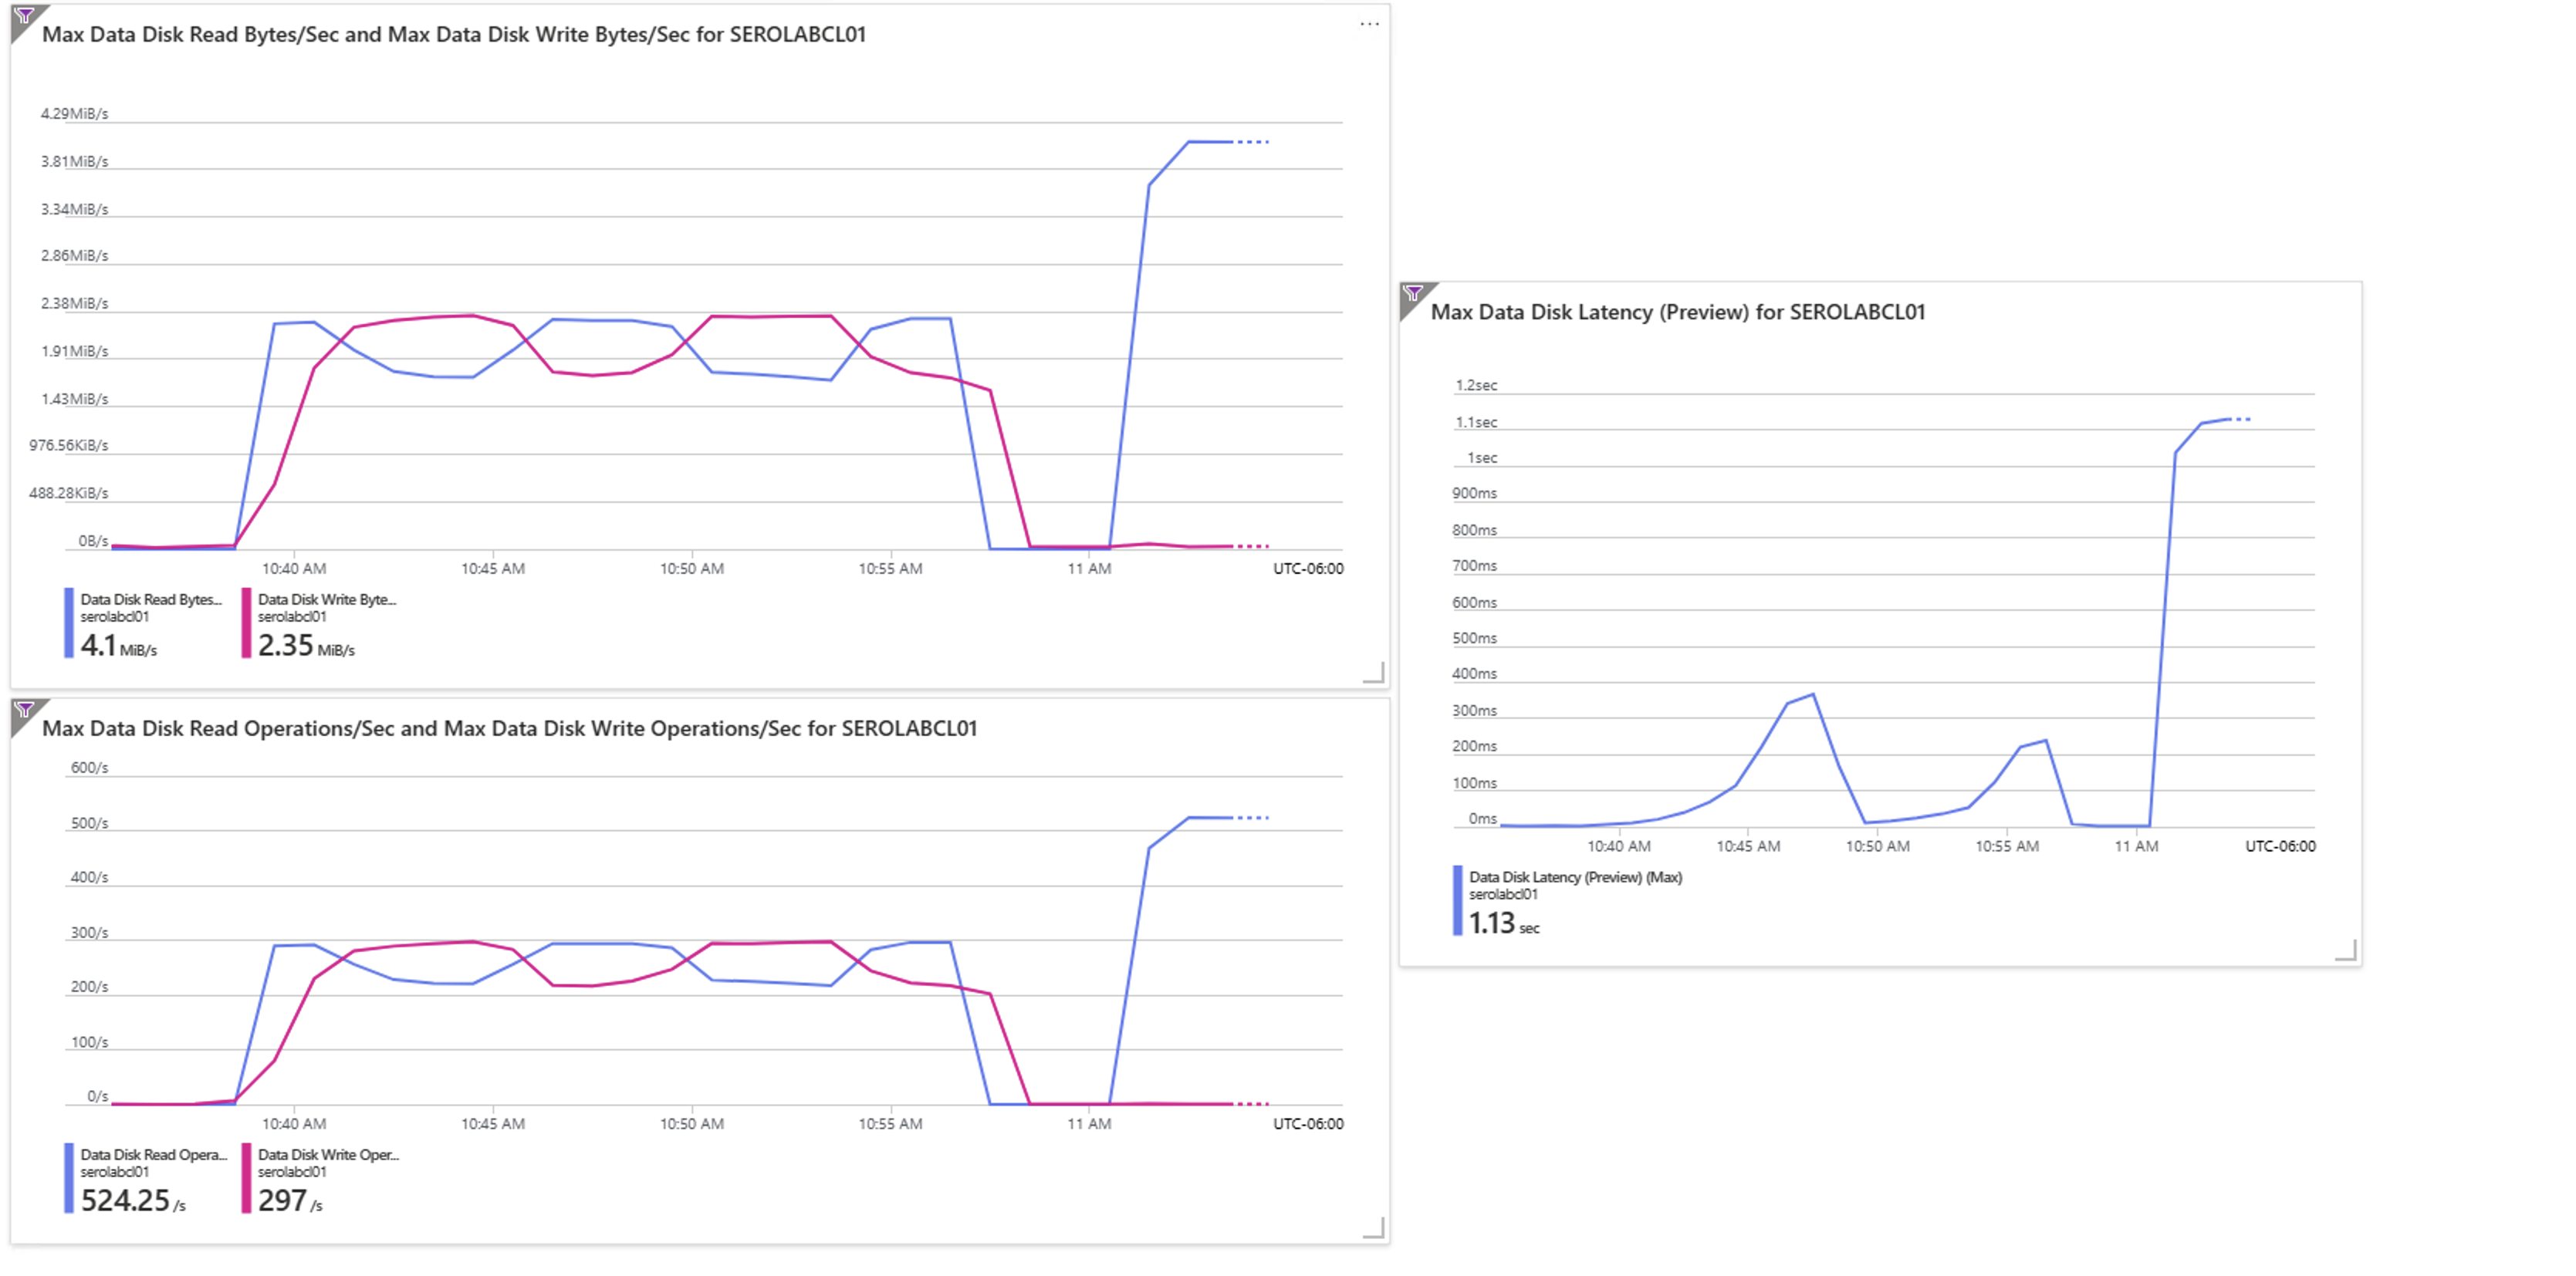
In the example above, we’ve maxed out on read IOPs, leading to severe latency (above 1 second). By maxing out on IOPs, we’re also limiting in how much data can be read from the disk. At 8kb blocks * 524 IOPs, the disk maxes out at 4.1 MB/s. It’s important to note that if your application reads or writes in larger block sizes it is possible to increase throughput at the cost of lowering IOPs.
Conclusion
The example above represents a bottleneck encountered at the disk vs. the VM size. We’re nowhere near the VM’s limit of 2,880 IOPs or 35 MBps. Azure VM Metrics is a fantastic way to review performance counters directly from within the Azure portal.
For more information
If you’d like some assistance assessing your SQL Server workload on an Azure Virtual Machine, reach out. We’re happy to help.
In the meantime, here are some other posts you may find interesting.
- Identifying SQL Server Disk Latency
- Identify Disk I/O Performance Issues for Your SQL Server Using DiskSpd
- Azure shared disks – Failover Clustered Instances
- How to Create SQL Server 2019 Failover Clustered Instances in Azure
- Why is My SQL Server Slow? 14 Common Reasons
- 10 Data Storage Considerations for Growing Companies
10 Responses
Модерни ежедневни рокли, които съчетават удобство и елегантност
стилни дамски рокли [url=https://www.rokli-damski.com/]https://www.rokli-damski.com/[/url] .
Модерни спортни екипи за дома и разходки в парка
спортни дамски комплекти [url=https://sportni-komplekti.com/]спортни дамски комплекти[/url] .
Прецизна изработка и внимание към детайла при дамски блузи
официални дамски блузи [url=https://bluzi-damski.com/]https://bluzi-damski.com/[/url] .
Индивидуальные решения для комфортного строительства деревянных домов
построить деревянный дом под ключ стоимость [url=http://www.stroitelstvo-derevyannyh-domov178.ru/]http://www.stroitelstvo-derevyannyh-domov178.ru/[/url] .
Готовые решения для семей, выбирающих строительство деревянного дома
дом деревянный под ключ [url=https://www.stroitelstvo-derevyannyh-domov78.ru]https://www.stroitelstvo-derevyannyh-domov78.ru[/url] .
Морская прогулка на яхте — яркие впечатления в Сочи без переплат
яхта аренда сочи [url=http://arenda-yahty-sochi323.ru/]http://arenda-yahty-sochi323.ru/[/url] .
A seamless betting experience with high-quality support from Mostbet
mostbet o’ynash [url=https://www.mostbet-uz-mosbet-kirish.com]https://www.mostbet-uz-mosbet-kirish.com[/url] .
Медицинская помощь при лечении алкоголизма на всех этапах
кодирование от алкоголизма эспераль [url=https://spb-lechenie-alkogolizma.ru/]https://spb-lechenie-alkogolizma.ru/[/url] .
Магазин шин с подбором по марке автомобиля и сезону
магазин шин и дисков [url=http://kupit-shiny0-spb.ru/]http://kupit-shiny0-spb.ru/[/url] .
Закажите стеклянное ограждение для душа и улучшите интерьер ванной комнаты
душевые ограждения из стекла без поддона [url=http://steklo777777.ru/]http://steklo777777.ru/[/url] .
Comments are closed.