
Coming Soon: The All-New SQL Server Daily Health Check and Dashboard
SQL Server is a critical component for many businesses, and its health and performance can have a significant impact on operations. If SQL Server is having a bad day, a lot of people are having a bad day. Users, patients, loan officers, etc, and of course, IT. That’s why we recommend performing a SQL Server Daily Health Check for every SQL Server that’s important in your environment.
You can do that manually by connecting to each one using Management Studio. You buy a monitoring tool and review each instance in your environment every morning.
Or you can automate the check. That’s what we’ve done for our clients.
How it works
The SEROShield Daily Health Checks and Dashboard is designed to proactively deliver the information you need to keep your SQL Server environment healthy, secure, reliable, and running smoothly.
Here’s an overview.
1. The Daily Health Check email
Every morning, our clients and our DBA team receives a Daily Health Check (DHC) email. The email provides a summary of the overall health of each SQL Server being monitored in their environment.
The DHC looks at a lot of information from each SQL Server, including:
- Failed user-created jobs
- Failed maintenance jobs that we create as part of our SEROShield DBA Team as a Service
- Windows Event and Application logs
- SQL Server and SQL Server Agent logs
- Low Disk space alerts
- Failed logon attempts
- Deadlocks
- Connection errors
- Availability Group errors
- And so much more….
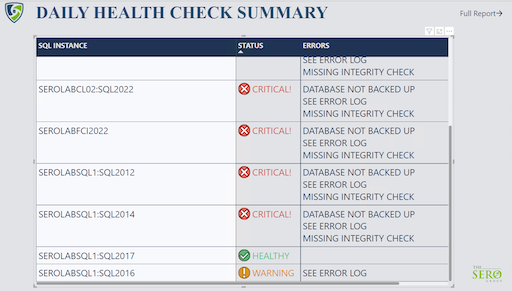
The DHC email distills all of that down to the core and summarizes it. Then it categorizes each SQL Server as:
- Red – Critical!
- Orange – Warning
- Yellow – Caution
- Green – Healthy
The email also provides a short reason for the categorization. The image below shows the DHC Email.
2. Daily Health Check Dashboard
So, you’ve received the DHC Email and something looks wrong. One of your SQL Servers is categorized as Critical! or Caution. What next?
You can click on the link in the email to see more information in the Daily Health Check Dashboard. It’s shown below.
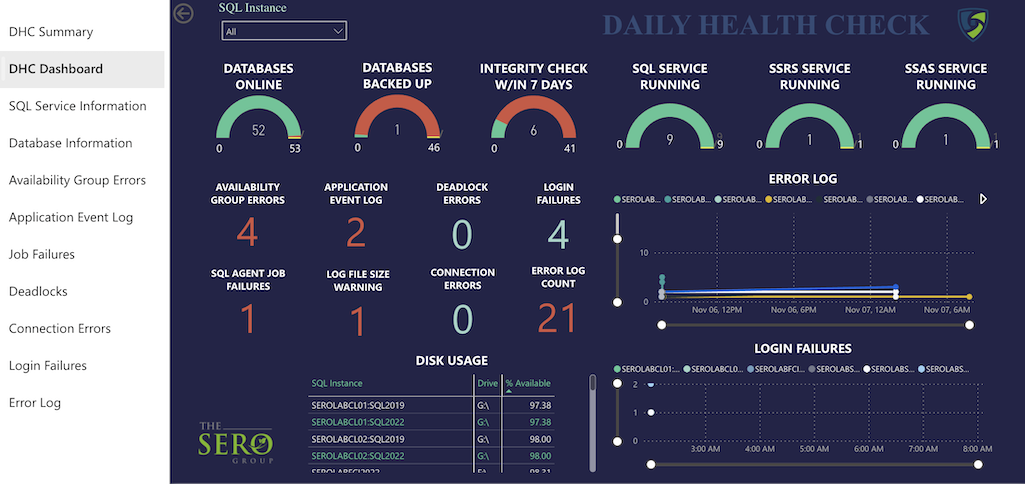
In the Dashboard, you can see a summary of the factors that help categorize the SQL Server, such as:
- Performance issues
- Security vulnerabilities
- Reliability concerns
- Recoverability problems
- Alerting/monitoring omissions
If you have multiple (or a lot) of SQL Servers in your environment, you can filter to look at only at the SQL Servers you’re concerned with.
3. Look at the history
The first page of the Daily Health Check Dashboard provides a good overview of the health of the SQL Server. If further investigation is needed, you can click on any of the dashboard graphics to go to a more detailed page for that metric.
For example, if you notice that jobs have failed, you can click on SQL Agent Job Failures and view a more detailed report page.
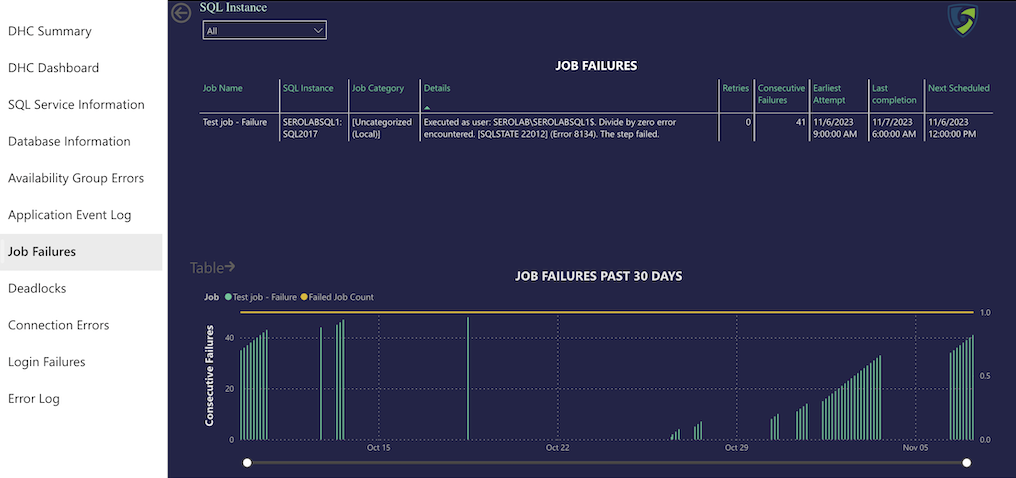
At the top of the page, you’ll see the job failures from the past 24 hours. The lower half of the report shows job failures from the past 30 days. You can click to toggle the timeline graphic to a table to review the data.
Each of the report pages – Deadlocks, Connection Failures, Availability Group Errors, etc – has the same design. The top half show the past 24 hours while the lower portion shows the past 30 days.
This can help you to identify trends and patterns, which can be helpful in troubleshooting and resolving problems.
What does a Daily Health Check do?
SEROShield Daily Health Checks and Dashboard is designed to help you (and our DBA Team) identify potential issues before they become disruptive events.
We use our process to help clients:
- Improved performance: By proactively monitoring your SQL Server environment, you can identify and resolve potential problems before they cause performance issues.
- Reduced downtime: SEROShield Daily Health Checks and Dashboard can help you to avoid downtime by alerting you to potential problems before they cause outages.
- Increased security: SEROShield Daily Health Checks and Dashboard can help you to identify and address security vulnerabilities in your SQL Server environment.
- Improved reliability: By proactively monitoring your SQL Server environment, you can ensure that your databases are always available and reliable.
- Reduced costs: SEROShield Daily Health Checks and Dashboard can help you to reduce costs by avoiding downtime and performance issues.
Want to know more?
The newly reimagined SEROShield Daily Health Check Email and Dashboard will be available in Q1 of 2024. We’re excited about the all-new Daily Health Check Email and Dashboard. We’re looking for feedback as we put the finishing touches on the design. If you’d like to help, we’d love your opinion. Sign for an upcoming Focus Group.
Or, if you are interested in learning more about how our SEROShield DBA Team as a Service helps to keep SQL Server healthy, reliable, secure, and performing well, contact us.
Recent Comments