Beware of Spurious Correlations when Analyzing Your “Big Data”

Machine Learning. Artificial Intelligence. Data Science. Deep Learning. Big Data Analytics.
These terms, and many like them, have been in the news a lot recently. And with good reason. Many organizations are taking their first tentative steps toward sifting through the vast amounts of data collected in disparate systems in search of hidden nuggets of insight to improve operations or some other aspect of business. Rushing headlong into a statistical analysis of their systems, they hope to find the next big thing.
Statistics for Statistic’s Sake?
But statistics for statistic’s sake is not very useful. A deep analysis of data is most interesting and useful when the results can be used to predict future outcomes based on prior correlations with a relatively high degree of certainty.
Baseball, for example, is an industry rife with relatively meaningless statistics. The traditional metrics of batting average and earned run average have proven to add relatively little value when evaluating a players contribution to a team’s chance of winning. Yet they have been given significant weight both on the field and in the back office. These statistics have been used to negotiate contracts, determine batting order, and influence the starting pitching rotation.
True Key Performance Indicators
Over the past ten years or so, a ton of other statistics have been identified and found to be far more predictive of successful outcomes. For example, on-base percentage and the ability to draw walks are more indicative of the positive offensive contributions of a player. From a pitching perspective, the ability to get a batter to hit a ground ball translates into more outs and hence more team wins than the traditional ERA metric. If you are interested in sports and data analytics, I would highly recommend the following two books: Moneyball: The Art of Winning an Unfair Game by Michael Lewis and Big Data Baseball by Travis Sawchik. Both are fascinating and entertaining reads, especially for the data-minded sports fan.
Like Major League Baseball, many organizations are combing through copious amounts of data looking for ways to improve operations, sales, manufacturing, etc. As an example, Target can identify pregnant patrons based on subtle changes in their buying habits, often before they have shared their good news with relatives. Disney has used RFID in its theme parks to track queue length, visitor travel patterns, etc, so they can adjust and improve operations.
Analyzing Your “Big Data”
As your organization begins to evaluate using data analytics to unearth hidden correlations that may influence your strategic initiatives, remember that to be truly relevant, statistics alone cannot tell the whole story. Subject matter experts from operations, HR, engineering, manufacturing, and other areas within the business should be involved with the project. They can offer great insight and help you to ask better questions. Without their expertise, meaningless correlations can be identified and inadvertently given credence.
Some Spurious Examples
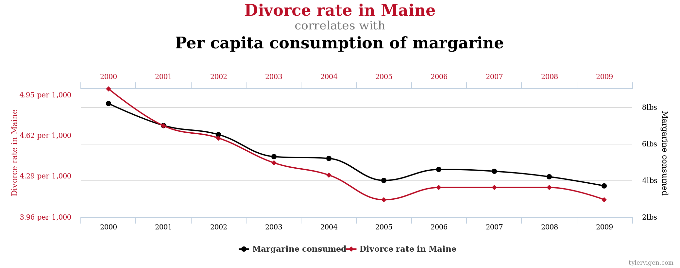
Some humorously extreme examples of these spurious correlations can be found at Tylervegin.com. For example, the divorce rate in Maine has an uncanny correlation to the amount of margarine consumed per capita annually. Spreading margarine on a biscuit causes a nasty breakup in Maine? Of course not, but the statistics imply otherwise.

Chart courtesy of TylerVigen.com.
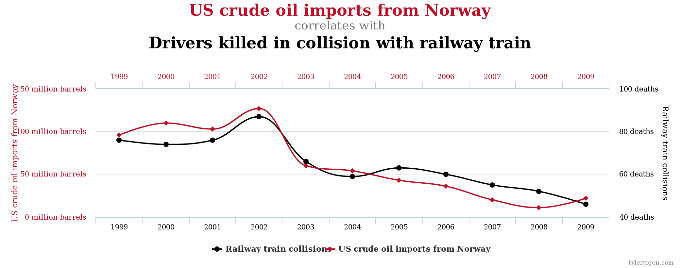
Likewise, the number of drivers killed annually in collisions with trains closely parallels the amount of crude oil imported into the US from Norway. If the U.S. wants to see the death toll drop to zero, lawmakers should ban importing crude oil from Norway? That’s preposterous. Well, to most of us, anyway. I don’t want to predict what Congress may do.

Chart courtesy of TylerVigen.com.
Obviously, these correlations do not imply causation. And, that’s the point. Without the right subject matter experts in the room, an analytics team may draw incorrect inferences and lead the organization on a wild goose chase.
Asking the Right Questions
Asking the right questions is key. And who better to ask great questions than Subject Matter Experts, end users, etc., when analyzing your “Big Data?”
Looking for some data to experiment with? Check out Data! Getcha Data Here!
Are you inviting the right people to your project’s table?


Recent Comments